Indoor RadioPlanner 2.1
Planning Tool for Wi-Fi and other Indoor Networks
User Manual


From the Developers
We have made every effort to create a user-friendly and intuitive application. However, we recommend taking some time to read this User Manual to fully utilize Indoor RadioPlanner’s capabilities. Created by engineers with over 25 years of experience in designing radio communication networks, Indoor RadioPlanner is a full-featured yet simple and convenient planning tool.
Features
Indoor RadioPlanner 2.1 is an easy-to-use software for planning Wi-Fi and other wireless networks deployed both indoors and in open local areas.
With Indoor RadioPlanner you can design any network, including:
-
Wi-Fi networks in the 2.4 GHz, 5 GHz and 6 GHz bands
-
Mobile networks: 5G (NR), LTE, UMTS, GSM, WCDMA, DECT
-
Public safety mobile networks: P25, TETRA, DMR, dPMR, NXDN
-
Wireless IoT LPWAN networks: LoRa, SigFox
Indoor RadioPlanner 2.1 also allows you to survey and visualize Wi-Fi networks.
Indoor RadioPlanner 2.1 uses propagation models:
-
ITU-R P.1238-11 propagation model “Propagation data and prediction methods for the planning of indoor radiocommunication systems and radio local area networks in the frequency range of 300 MHz to 450 GHz”.
Indoor RadioPlanner 2.1 performs various prediction types:
-
Received Power
-
Secondary Received Power
-
Best Server
-
C/(I+N) Ratio
-
Maximum Throughput
-
Number of Servers
-
RSRP for LTE and 5G
-
RSRQ for LTE and 5G
-
Signal to Noise Ratio for Wi-Fi
-
Channel Interference for Wi-Fi
-
Maximum aggregated Throughput
-
Number of Networks
In Indoor RadioPlanner 2.1, you can work with two types of projects:
-
Indoor project: When access points are placed inside a single- or multi-story building. In this type of project, it is possible to predict detailed coverage on different floors inside buildings, taking into account individual parameters of signal loss of internal walls, RF Zones of different rooms, as well as losses in floor slabs.
-
Outdoor project: When access points are placed in an outdoor local area up to 2 by 2 km in size. In this type of project, it is possible to predict coverage inside and outside buildings - along streets, in open local areas, etc. Buildings in such a project have two parameters - RF zone type (one for the entire building) and external wall type. In an outdoor project, you can use a regular base map (OpenStreetMap, etc.), or a base map based on a calibrated image.
Indoor and Outdoor projects are not compatible with each other; the user must select the project type in Settings before starting work.
Installation and Activation
Indoor RadioPlanner is compatible with Windows 10/11 x64 and ARM processors. The minimum computer requirements include a 64-bit Windows operating system, Core i3 CPU, 4GB RAM, 200GB HDD, video card, and monitor with support for 1366x768 resolution. For optimal performance, it is recommended to use a monitor with support for 1920x1080 resolution.
To install Indoor RadioPlanner, run the Setup_Indoor_ RadioPlanner.exe file. Select your language and click Install to launch the installation process. Click Next to continue. To proceed with the installation, read and accept the License Agreement by checking the box next to “I accept the terms in the License Agreement” and clicking Next.
After installing Indoor RadioPlanner, you will see a new entry in the Start menu and a shortcut on your desktop.
During the 7-day trial period, you can try all of the software features without activation (except for the option to save project files).
After the trial period has expired, you must purchase a license and activate the software to continue using it.
Note: The activation process requires an internet connection.
To purchase Indoor RadioPlanner, click Help - Purchase in the program menu. This will open the purchase page in your web browser. After completing your purchase, you will receive an activation ID code via email. To activate your software, click Help - Enter Activation ID Code in the program menu, enter your code, and click ACTIVATE.
Software Update
We periodically release free updates to improve the functionality and stability of Indoor RadioPlanner. The software supports both manual and automatic checking for updates and will check for available updates every time it starts. To check for updates manually, click “Help - Check for updates.” If an update is available, a window will open with information about the current and available versions. You can download the update from the provided link and install it manually. Be sure to exit Indoor RadioPlanner before installing the update.
User Interface
The program window includes the following elements:
-
The main tree view menu on the left side of the window.
-
The main toolbar, located at the top of the window.
-
The central work area, which displays the level (floor) plan with access points, RF zones, walls, and coverage prediction results.
-
The objects control panel, located in the lower-left part of the window. This panel allows you to enable or disable editing of objects on the map (Access Points, Reference Points, Walls, RF Zones, Level Plans, Coverage), as well as control their visibility.
To zoom in and out, roll the mouse wheel. To move the level plan, click and drag it.

Main Toolbar
Standard tools for working with files: Create, Open, Save
Save the project
7
The zoom of the level plan
Calculate Coverage for current level
Maximum Throghput (DL)
Calculation type shown on display
Wi-Fi 5 GHz
Network for which calculation results are displayed
The “ruler” tool allows you to measure the distance and azimuth between any two points on the map. To use this tool, click on the ruler icon and then click on any two points on the map. The distance between the points and the azimuth from the first to the second point will be displayed. To exit the tool, click it again or press Esc.
Wi-Fi Monitor
Wi-Fi Survey List
Wi-Fi Survey Visualization
Snap to Nodes. Enable/disable snapping to nodes when drawing walls and RF zones
Show / Hide Legend
Save the map as an image in PNG format
Save the access points and networks settings to a CSV file
Help
For more detailed information about each tool, please refer to the corresponding sections in the User Manual.
Quick start of Indoor Project
-
Make sure the project type is set to "Indoor" in the settings (this is the default).
-
Create at least one network: Go to “Networks – Add network”. Network settings can be loaded from a template. Templates for some networks are located in the “Templates” folder and have a *.nwirp extension.
-
Create at least one level (floor): Select “Levels – Add level”. Then, from the Level menu, load and scale the level image. Specify the reference point to which all other levels will be aligned.
-
Draw RF zones and walls on the level.
-
Add at least one access point with one System (communication technology) to the level: Access point parameters can be loaded from a template. Templates for some access points are located in the “Templates” folder and have a *.apirp extension. Link the access point system with the previously created network. After creating one access point and entering all its parameters, you can easily replicate it to create additional ones.
-
Configure the calculation parameters in the network settings as needed.
-
To perform calculations: Click “Calculate Coverage for current level” on the main toolbar. This will execute all types of calculations for all networks simultaneously.
-
Select the type of calculation and the network for display: Use the drop-down list on the main toolbar to choose the calculation type and the network for which the results will be displayed.
Tip: To get started quickly, utilize the example project files available in the installation folder.
Project Information
General information about the project can be specified in the project information panel.

Project Information
Project name
Customer
Data
Logo
Text field
Text field
Text field - When creating a new project, it records the date and time of the project creation.
Your company logo. The recommended resolution is approximately 270 by 60 pixels.
Settings
In the project settings, the user selects the project type. If the project type is Indoor, no additional settings are required. If you select the project type Outdoor, additional settings will appear.
Please note that when changing the project type, all previously entered information about wireless access points in the project will be lost!

Indoor Projects Settings

Outdoor Projects Settings
General Calc Parameters
Here, a number of general calculation parameters are specified, well as penetration losses for different wall types. As is known, same materials have different attenuation values for different frequencies. The default attenuation values are provided for the 800 MHz, 2.4 GHz, 5 GHz, and 6 GHz ranges. If a frequency outside the specified ranges is used in the calculations, the attenuation value will be determined by interpolation or extrapolation.
The user can change the penetration loss values in the table for 24 wall types and one type of interfloor ceiling at their own discretion, based on the available for different frequency ranges (no more than four frequency bands).
All fields in the table with a white background are editable; that is, the can change the name of the wall type, the frequency range, and the corresponding loss value. The wall and wall thickness in pixels affect only the display of the corresponding wall the monitor.
The table with user-defined penetration loss data can be saved as template in a *.wlirp file for use in other projects. It is also possible to restore the default loss data. The corresponding buttons are provided on the above the table.

General Calc Parameters
Area Study Resolution
Coverage prediction resolution, m
The recommended value for Indoor projects is 0.2-0.3 meters. For Outdoor projects - 0.5m-1m.
UE Antenna Height
Study radius
Coverage Transparency
Take into account adjacent floors
Outdoor RF Environment
User Equipment antenna height, m
Maximum study radius from access point, m The larger the radius, the longer the computation time. Do not set an unnecessarily large calculation radius.
Set coverage opacity in the range from 0 (fully transparent) to 10 (not transparent)
Indoor RadioPlanner takes into account the penetration of useful signal and interference only from access points located on adjacent floors, i.e. one floor above and one floor below.
RF Environment for outdoor spaces in Outdoor project type
Wall parameters:
Color
Width (pixels)
Load wall parameters from a template
Save wall parameters as a template
Fill the table whith default values
Wall color on screen
Wall thickness on screen in pixels
Objects visibility and locking Panel
The Objects Visibility and Locking Panel is located in the lower-left part of the program window. This panel enables you to:
-
Control the visibility of objects on the map, such as Access Points, Reference Points, Walls, Buildings (for outdoor project types), RF Zones, Floor Plan (base map for outdoor project), Survey Points, Survey Visualization and Predicted Coverage, by toggling them on or off.
-
Lock or unlock layers to permit or restrict editing.

Visibility and locking of objects are managed by clicking on the icons located opposite the corresponding objects in the list. To edit objects, they must be both visible and unlocked. This is achieved by setting the icons to the
Levels
In Indoor projects, you can create buildings with an unlimited number of levels (floors). In outdoor projects, you can only create one level.
Levels menu for Indoor project

Levels menu for Outdoor project
Level plan options
Add a new level
Collapse all level nodes
Collapse all AP nodes
Expand all AP nodes
Calibrated image or base map (for outdoor project only)
Level

Level menu
Level plan image
Move the Level up
Move the Level down
Delete Level
Add a new Level with the same parameters (duplicate the Level)
Position the plan with Reference Point at the screen center
Move the reference point and the line to the screen center
Add a new Access Point
Delete all APs from the Level
Delete all walls from the Level
Add new RF Zone
Add new wall
Add wall or building like as circle or rectangle
Square corners of selected objects
Add a node. Select an object (RF zone or wall) and click in the desired location to create a node.
Delete node. Select an object (RF zone or wall) and click on the node you want to delete.
Select walls, RF Zones, Buildings inside square area
Select walls, RF Zones, Buildings inside area
Duplicate selected objects (walls, RF Zones, buildings)
Add a new building
Import buildings from OpenStreetMap database
Add Wi-Fi Survey Point
Copy selected object to clipboard
Paste objects from clipboard
Undo
Redo

Import Level plan
Import level plan image
Delete level plan image
Creating a building RF Environment Model
The basic propagation model ITU-R P.1238-11 takes into account two parameters related to the propagation environment:
N: Power loss over distance (RF propagation parameter) shows how much the signal level drops in dB when the distance from the signal source changes by a factor of 10 (per decade).
Lf, dB: Floor slab or wall penetration loss factor (in dB) for floor slabs or walls located between the access point and the subscriber terminal (UE).
In Indoor RadioPlanner 2.1, different approaches to forming an RF environment model are used for indoor and outdoor projects.
In the Indoor project, a model of a single- or multi-story building is created with the ability to specify individual loss parameters for each wall and RF Zone of individual rooms.
For Outdoor projects, buildings are created with their own RF Zone (one type per building) and the external wall (also one type per building). And one type of RF Zone is also specified for the external environment.
Indoor Projects
RF Environment (RF Zones)
To create RF environment model inside a building, you need to draw different RF zones and walls with corresponding loss parameters.

RF Zone parameters
You can draw the following RF environment types on the floor plan:
• Open Space (large open space with almost no obstacles) - 25 dB/dec
• Light RF Environment (cubicle office area, low warehouse stock) - 30 dB/dec
• Medium RF Environment (closed office area, medium warehouse stock) - 35 dB/dec
• Dense RF Environment (many rooms with light material, high warehouse stock) - 40 dB/dec
• High-Density RF Environment (many rooms with heavy material, elevator shaft) - 45 dB/dec
• Atrium - large opening in the floor (hole), excluded from prediction calculations
Working with RF Zones
Before drawing RF zones, ensure the object layer is unlocked for editing.
Adding an RF Zone:
-
Click on the RF Zone tool in the level toolbar.
-
Draw a polygon to represent the RF environment using the mouse (right-click to complete the polygon).
-
Select the RF environment coefficient from the list that appears.
-
Press Esc or select another tool from the toolbar to complete your entry.
-
For added convenience, use the Snap to Nodes tool on the main toolbar.
Operations on RF Zones:
-
Edit Shapes: Drag the nodes of polygons to modify their shape.
-
Move Polygons: Click and drag to reposition entire polygons.
-
Delete Polygons: Select a polygon and press Delete to remove it.
-
Cancel Drawing: Press the Esc key to cancel the current RF zone drawing. Pressing Esc again will exit the RF zone drawing mode.
Walls
You can draw on the plan and take into account the walls whose parameters are specified in the Calculation Parameters panel – Wall Parameters. You can use the default wall parameters or set your own by editing the Wall Parameters table at your discretion (see the Calculation Parameters section).

Wall parameters
Drawing Walls
Before drawing walls, ensure the object layer is unlocked for editing.
To Add a Wall:
-
Click on the Wall tool on the level toolbar.
-
Use the mouse to draw the wall (right-click to finish).
-
Select the wall type from the list that appears.
-
Press Esc or select another tool from the toolbar to complete your entry.
-
For more convenient work, use the Snap to Nodes tool on the main toolbar.
Operations on Walls:
-
Edit Shapes: Drag the nodes of walls to modify their shape.
-
Move Walls: Click and drag to reposition entire walls.
-
Delete Walls: Select a wall and press Delete to remove it.
-
Cancel Drawing: Press the Esc key to cancel the current wall drawing. Pressing Esc again will exit the wall drawing mode.
Outdoor Projects
Buildings
For outdoor projects, buildings are created, each with only three parameters: internal RF zone attenuation, external wall losses, and building height. Additionally, in the general calculation parameters, it is necessary to specify the type of RF zone for the external environment. You can either draw buildings or import them from the OpenStreetMap database.

Building parameters
The wall type and penetration loss parameters for different ranges are specified in the Wall Parameters table in the Calculation Parameters panel. You can use the default parameters or specify your own (for more information, see the Calculation Parameters section).
Working with Buildings
Before drawing Buildings, ensure the object layer is unlocked for editing.
Add Buildings manually:
-
Click on the Add a new Building in the level toolbar.
-
Draw a polygon to represent the building using the mouse (right-click to complete the polygon).
-
Specify building height.
-
Select the exterior wall type from the list
-
Select the indoor RF Zone from the list.
-
Press Esc or select another tool from the toolbar to complete your entry.
Import buildings from OpenStreetMap database (Only for outdoor projects with basemap):
-
Click Import buildings from OpenStreetMap database on the level toolbar.
-
Mark the area on the map where the buildings will be imported (no more than 2 by 2 km).
-
In the form that appears, specify the parameters of the heights and floors of the buildings if there is no information about them in the database.
-
Specify the RF Zone type and the type of external walls for all buildings at once or separately for each building.
Buildings imported in this way can then be edited manually.
Operations on Buildings:
-
Edit Shapes: Drag the nodes of polygons to modify their shape.
-
Move Polygons: Click and drag to reposition entire polygons.
-
Delete Polygons: Select a polygon and press Delete to remove it.
-
Cancel Drawing: Press the Esc key to cancel the current RF zone drawing. Pressing Esc again will exit the Buildings drawing mode.
Networks
Indoor RadioPlanner 2.0 allows you to work with multiple networks in one project. When creating a new project, the first network is created by default.

Networks menu
Add a new network
Area Study Type
Coverage predictions for multiple networks:
- Number of Networks (DL)
- Number of Networks (UL)
- Maximum Aggregated (DL) Throughput
- Maximum Aggregated (UL) Throughput
See Coverage predictions for multiple networks section
The “Network” menu is used to set all parameters for the selected network and calculation parameters.
Network Parameters

Network menu
Add a new network with the same parameters (duplicate the network)
Delete the network
Move the Network up
Move the Network down
Activate/Deactivate all systems for current network
System parameters
Load network parameters from a template
Save network parameters as a template
Network name
System type
Band
UE Tx Power
Downlink Rx threshold
Uplink Rx threshold
UE Antenna Gain
UE Loss
Use UE directional antenna pattern
Use co-channel interference
Use adj-channel interference
Name of network, text field
System type options:
-
Wi-Fi
-
LTE
-
5G
-
Generic TRX
The selected system type will determine the set of additional system parameters, as well as the types of coverage predictions available.
Average band frequency, MHz
User Equipment (mobile unit) transmitter power, dBm
This threshold value will limit the coverage prediction display based on whether the signal received at the UE from the access point is above or below this threshold, dBm
This threshold value will limit the coverage prediction display based on whether the signal received at the access point from UE is above or below this threshold, dBm
User Equipment antenna gain, dBi
User Equipment cable loss, dB
Use the antenna pattern at the UE. By default, the UE antenna pattern is assumed to be isotropic. The use of directional antennas on the UE significantly reduces interference from neighboring cells and, as a result, increases throughput.
Perform coverage calculation taking into account co-channel interference using frequency assignments.
Perform coverage calculation taking into account adjacent channel interference using parameters in network settings (Channel bandwidth and Adjacent Channel rejection) as well as frequency assignments.
Wi-Fi System Parameters

Wi-Fi Network menu
Band
Signal Correction
Minimum Received Power
Noise Floor for Bandwidth 20 MHz
Band: 2.4GHz/5GHz/6GHz
Signal Correction (Offset), dB.
When calculating the Rx level, it is assumed by default that the Wi-Fi client device has an antenna gain of 0 dBi and that there are no additional losses in the receiving path. If your client device has different antenna path parameters, you can account for this here. If the receiving path parameters your client device are worse, the offset will be negative.
The minimum level at the receiver that is taken into account in calculations is measured in dBm. It also determines the minimum RSSI threshold for the Best Server overlapping.
The specified value of noise from external sources for 20 MHz bandwidth that is used to calculate the SNR in dBm.

Wi-Fi Network menu
This form is used to enter SNR values different modulation indices across all standards and bandwidths. It is also possible to estimate the data rate (physical rate) for the given parameters: standard, bandwidth, spatial streams, guard interval.
LTE System Parameters

LTE System Parameters
Mode
LTE duplex mode:
- FDD
- TDD
Bandwidth
Cyclic Prefix
TDD UL/DL Ratio
R1/R3 FDD Ratio
TDD R1 Ratio
FFR SINR Threshold
Cell Load
Downlink and Uplink 3GPP Tables
LTE bandwidth: 1.4 MHz; 3 MHz; 5 MHz; 10MHz; 15 MHz; 20 MHz
LTE Cyclic Prefix:
- 4.7 µs (Normal)
- 16.7 µs (Extended)
TDD configurations in 3GPP LTE specification:
TDD Configuration # UL/total ratio DL/total ratio
0 0.7 0.3
1 0.5 0.5
2 0.3 0.7
3 0.35 0.65
4 0.25 0.75
5 0.15 0.85
6 0.6 0.4
Type of Fractional Frequency Reuse (FFR) plan that is being used in LTE project in the R1/R3 zone Resource Blocks drop-down list
Part (from 0.1 to 1) the R1 zone subcarriers of physical resource blocks (PRB) for TDD
SINR threshold for switching between R1 and R3 zones in FFR, dB
Cell Load, 0-100 % Cell Loading is considered uniform.
These tables contain the MCS Index, modulation type, and transport block size (TBS) specified in the tables of 3GPP TS 36.213. Minimum C/(I+N) values for 1% SER (dB) can be specified separately for both uplink and downlink. The theoretical defaults shown in this table are from published MATLAB simulations of LTE radio link performance. The throughput for each modulation index is determined from the 3GPP tables, taking into account the transport block size. This throughput does not take into account the MIMO multiplier.
Network Channel Plan
In the channel table, specify all possible uplink and downlink frequencies (channels) that will be used in the network. For TDD, enter the same frequency. If the network operates on a single channel, then the frequencies in the Network Channel Plan may not be specified.

LTE Network Channel Plan
MIMO Configuration
The MIMO table is fully configurable for all downlink and uplink scenarios.
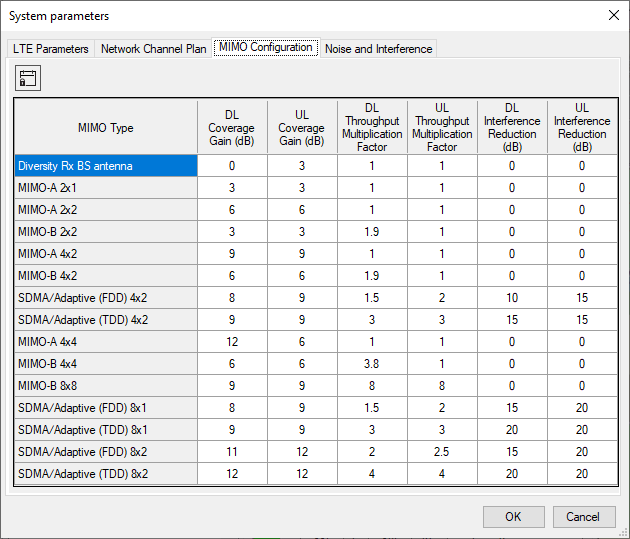
LTE MIMO Configuration
Noise and Interference
The receiver parameters in this tab are used for noise and interference calculations.

LTE Noise and Interference
Rx equivalent noise bandwidth
Receiver Equivalent Noise Bandwidth, MHz
In LTE systems, when using all resource blocks, the following noise bandwidths are obtained:
1.08 MHz (1.4 MHz Bandwidth)
2.7 MHz (3 MHz Bandwidth)
4.5 MHz (5 MHz Bandwidth)
9 MHz (10 MHz Bandwidth)
13.5 MHz (15 MHz Bandwidth)
18 MHz (20 MHz Bandwidth)
Rx noise figure
Rx noise level
Adjacent channel rejection
Receiver noise figure, dB Typically 3-4 dB for eNodB and 6 dB for UE
Receiver noise level, dB This value is used to estimate the noise on the receiving path when calculating all types of interference.
Adjacent channel rejection, dB It is assumed that the receiver has a rectangular “brick wall” bandpass shape with a width equal to the equivalent noise bandwidth. Under these conditions, you can set the amount of attenuation on adjacent channels (one bandwidth above and below the desired bandwidth) by entering a value here for adjacent channel rejection.
5G (NR) System Parameters

5G Parameters
Mode
Duplex mode:
- FDD
- TDD
Configuration
Downlink and Uplink 3GPP Tables
Choice from bandwidth (BW) and Subсarrier Spacing (SCS) configurations.
These tables contain the MCS Index, modulation type, and Target code rate specified in the tables of 3GPP TS 36.214. Minimum C/(I+N) values for 1% SER (dB) can be specified separately for both uplink and downlink. The theoretical defaults shown in this table are from published MATLAB simulations of 5G radio link performance. The throughput for each modulation index is determined from the 3GPP tables. This throughput does not take into account the MIMO multiplier.
DL symbols part in TDD slot (0..1)
Part of the TDD resource that is intended for downlink
Cell Load, 0-100 % Cell Loading is considered uniform.
Network Channel Plan
In the channel table, specify all possible uplink and downlink frequencies (channels) that will be used in the network. For TDD, enter the same frequency. If the network operates on a single channel, then the frequencies in the Network Channel Plan may not be specified.

5G Network Channel Plan
MIMO Configuration
The MIMO table is fully configurable for all downlink and uplink scenarios.

5G MIMO Configuration
Noise and Interference
The receiver parameters in this tab are used for noise and interference calculations.

5G Noise and Interference
Rx equivalent noise bandwidth
Receiver Equivalent Noise Bandwidth, MHz
In 5G, the noise band can be obtained from the formula:
Rx equivalent noise BW= 12*SCS*Resource Blocks.
For example, for BW=100 MHz, SCS=30 kHz
Rx equivalent noise BW=12*0.03*273=98.28 MHz
Rx noise figure
Rx noise level
Adjacent channel rejection
Receiver noise figure, dB Typically 3-4 dB for eNodB and 6 dB for UE
Receiver noise level, dB This value is used to estimate the noise on the receiving path when calculating all types of interference.
Adjacent channel rejection, dB It is assumed that the receiver has a rectangular “brick wall” bandpass shape with a width equal to the equivalent noise bandwidth. Under these conditions, you can set the amount of attenuation on adjacent channels (one bandwidth above and below the desired bandwidth) by entering a value here for adjacent channel rejection.
Generic TRX System Parameters
Generic TRX in Indoor RadioPlanner includes all mobile communication systems except Wi-Fi, LTE and 5G:
-
DECT
-
UMTS / GSM / GSM-R / WCDMA mobile networks
-
P25 / TETRA / DMR / dPMR / NXDN land mobile radio networks
-
Networks based on wireless IoT LPWAN technologies: LoRa, SigFox, and others
Adaptive Modulation Table
The adaptive modulation table is filled with SINR values and their respective throughput for one spatial stream (no MIMO). This table is used to predict downlink and uplink throughput in Generic TRX.
Please note that Wi-Fi, LTE and 5G have different adaptive modulation tables.

P25 Modulation Table
Modulation Type
DL Throughput
DL SINR (dB)
UL Throughput
UL SINR (dB)
Mbps or kbps
Modulation Type (text field)
Downlink Throughput, Mbps or kbps
Downlink SINR,dB
Uplink Throughput, Mbps or kbps
Uplink SINR,dB
Select Throughput Units
Network Channel Plan
In the channel table, specify all possible uplink and downlink frequencies (channels) that will be used in the network. For TDD, enter the same frequency. If the network operates on a single channel, the frequencies in the Network Channel Plan may not need be specified.

DECT Channel Plan
Sort frequencies in ascending order
Autofill downlink frequencies
Autofill uplink frequencies
If your network has a large frequency grid, then you can use the autofill feature:

Channel Autofill
MIMO Configuration
The MIMO table is fully configurable for all downlink and uplink scenarios.
Generic TRX MIMO Configuration
Noise and Interference
The receiver parameters in this tab are used for noise and interference calculations.

Generic TRX Noise and Interference
Rx equivalent noise bandwidth
Rx noise figure
Rx noise level
Adjacent channel rejection
Receiver Equivalent Noise Bandwidth, MHz
Receiver noise figure, dB Typically 3-4 dB for base station and 6 dB for UE
Receiver noise level, dB This value is used to estimate the noise on the receiving path when calculating all types of interference.
Adjacent channel rejection, dB It is assumed that the receiver has a rectangular “brick wall” bandpass shape with a width equal to the equivalent noise bandwidth. Under these conditions, you can set the amount of attenuation on adjacent channels (one bandwidth above and below the desired bandwidth) by entering a value here for adjacent channel rejection.
Access Points
An access point within Indoor RadioPlanner is a device that can encompass one or more systems (technology standards).
To create a first Access Point, click on Level in the Tree View interface, then click the "Add a new Access Point" button in the panel that opens. Subsequently, it is efficient to generate additional access points based on the first one created.

Access Point Parameters
Add a new system
Add a new Access Point with the same parameters (Duplicate)
Delete this Access Point
Move Access Point up
Move Access Point down
Position the plan with the Access Point at the center of the screen
Load Access Point parameters from a template
Save Access Point parameters as a template
Copy this AP to clipboard
Name
Equipment
Latitude
Longitude
AP name, text field
Name (model) of AP equipment, text field
Latitude (only for outdoor projects with Basemap underlay)
Longitude (only for outdoor projects with Basemap underlay)
The antenna configuration at one Access Point can be of three options:
-
All systems have omnidirectional antennas
-
All systems have directional antennas with same azimuth
-
All systems have directional antennas with different azimuths (for outdoor projects only)
Antenna parameters depend on system configuration options and may be specified here or in specific system parameters.
There is an activity icon next to each access point and system in the tree view of the interface. For a system to be calculated, it must be marked as active (the dot in the center). When you click on a system, a panel with its parameters will open.
All Systems Except Wi-Fi

5G System Parameters
Add a new System with the same parameters
Delete the System
Move Access Point up
Move Access Point down
Channel Plan
Position the map with the system at the center of the screen
Global Active System parameters change. You can replace the selected parameters for all active Systems as the current System.
Name
Network
MIMO
Tx Power
Cable Loss
Antenna Gain
Azimuth
Antenna Height
Antenna Beam Tilt
Best Server Color
System name, text field
The network to which the System belongs, select from the drop-down list of networks.
MIMO type for the System, selection from a drop-down list of all possible MIMO configurations specified in the parameters of this network.
Transmitter power, dBm
Loss in cable, dB
Antenna gain, dBi
The azimuth of the antenna in degrees
The antenna height, m
Tilt the antenna in degrees. Down is negative; up is positive.
Load MSI antenna pattern file. An antenna pattern file is a standard MSI file that can be downloaded from the antenna manufacturer's website. Antenna patterns are integrated into the project file.
Select OMNI antenna pattern
Coverage color for Best Server study

Global Active Systems parameters change
Global Active System parameters change is a feature that allows you to instantly change the parameters of any active Systems to match those of the current System. To perform group parameter changes, mark the Systems whose parameters need to be changed as active, set the required parameter values in the current System, click on the button Global Active System parameters change, select the parameters that need to be changed in the previously marked active systems from the list, and click on the OK button.
Channel Plan
In the Sector Channel Plan, you can select specific frequencies (or channel numbers) from the entire frequency grid specified in the System Parameters of this network.

Channel Plan for BS DECT
Wi-Fi Systems

Wi-Fi System Parameters
Add a new System with the same parameters
Delete the System
Move Access Point up
Move Access Point down
Position the map with the system at the center of the screen
Global Active System parameters change. You can replace the selected parameters for all active Systems as the current System.
Name
Network
802.11 Standard
Channel Width
Spatial Streams
Guard Interval
Tx Power
Cable Loss
Antenna Gain
Azimuth
Antenna Height
Antenna Beam Tilt
Best Server Color
System name, text field
The network to which the System belongs, select from the drop-down list of networks.
Select a standard from the 802.11 list. The list of available standards may differ depending on the selected band for the Network.
Channel Width, MHz
Spatial Streams
Guard Interval, µs
Transmitter power, dBm
Loss in cable, dB
Antenna gain, dBi
The azimuth of the antenna in degrees
The antenna height, m
Tilt the antenna in degrees. Down is negative; up is positive.
Load MSI antenna pattern file. An antenna pattern file is a standard MSI file that can be downloaded from the antenna manufacturer's website. Antenna patterns are integrated into the project file.
Select OMNI antenna pattern
AP Coverage color for Best Server study

Global Active Systems parameters change for Wi-Fi
Global Active System parameters change is a feature that allows you to instantly change the parameters of any active Systems to match those of the current System. To perform group parameter changes, mark the Systems whose parameters need to be changed as active, set the required parameter values in the current System, click on the button Global Active System parameters change, select the parameters that need to be changed in the previously marked active systems from the list, and click on the OK button.
Area Study (Coverage Prediction) types
Indoor RadioPlanner 2.1 performs various types of area studies:
-
Received Power
-
Secondary Received Power
-
Best Server
-
C/(I+N) Ratio
-
Maximum Throughput
-
Number of Servers
-
RSRP for LTE and 5G
-
RSRQ for LTE and 5G
-
Signal to Noise Ratio for Wi-Fi
-
Channel Interference for Wi-Fi
-
Maximum aggregated Throughput
-
Number of Networks
Coverage calculation parameters are configured in the Network Parameters.
When you click the "Calculate Coverage for Current Level" button on the main toolbar, all prediction types are performed at once. The prediction displayed on the screen can then be selected from the main toolbar.
The availability of a particular area study type is determined by the type of system chosen:

Received power (RSSI) Downlink/Uplink
Received power maps show those areas where a given signal power level is present at the receiver.
You can choose prediction visualization as a heat map or a composite grid.

Received power as a heatmap visualization
Max Level
Min Level
Max visualization level, dBm
Min visualization level, dBm

Received power as a composite grid visualization
Number of Levels
Color
Values
Description
The number of levels (1-8)
Color level
Received power level, dBm
Text field to describe signal level
%20Coverage%20Prediction%20for%20Wi-Fi.png)
Indoor Received Power (RSSI) Coverage Prediction for Wi-Fi

Outdoor Downlink Received Power Coverage Prediction
Secondary Received power Downlink
The Secondary Received Power Coverage Map shows the areas of the second strongest signal at the receiver. You can choose prediction visualization as a heat map or a composite grid.

Secondary Received power as a heatmap visualization
Max Level
Min Level
Max visualization level, dBm
Min visualization level, dBm

Secondary Received power as a composite grid visualization
Number of Levels
Color
Values
Description
The number of levels (1-8)
Color level
Secondary Received power level, dBm
Text field to describe signal level

Indoor Secondary Received Power Coverage Prediction for Wi-Fi
Best Server Uplink/Downlink
The Best Server map shows the identity of the system supplying the strongest received signal at each location. The minimum received signal level for calculating the Best Server is downlink/uplink Rx threshold. The system color is defined in the sector parameters or can be assigned automatically.

Best Server Study Type Parameters
Apply Automatic Color Assignment
Assign colors to sectors in random order
Use Colors from System parameters
Assigning based on colors specified in system parameters

Best Server Indoor

Best Server Outdoor
C/(I+N) Ratio Downlink/Uplink
The carrier-to-interference+noise ratio (C/(I+N)) is an essential quantity used in assessing system performance and affecting frequency planning. Indoor RadioPlanner allows you to calculate and display areas with different downlink/uplink C/(I+N) values for interference on co-channel and adjacent channels.
Carrier-to-interference+noise ratio is calculated by first finding the strongest received signal power at each location, then calculating the sum of received signal powers from all other co-channel and adjacent systems (taking into account adjacent channel rejection) that also have relevant signal levels at that location. After finding the sum of interference, the carrier-to-interference+noise ratio is calculated.
The interference calculation always takes into account the noise component, which depends on noise bandwidth and receiver noise figure entered in Noise and Interference in Network system settings. The calculation of adjacent channel interference can be disabled to only take into account co-channel interference.

C/(I+N) Downlink Ratio Study Type Parameters
Number of Levels
Color
Value
Description
The number of levels
Color level
Carrier-to-interference+noise ratio C/(I+N), dB
Text field
%20Downlink%20for%20LTE.png)
C/(I+N) Downlink for LTE
Signal to Noise Ratio (SNR) for Wi-Fi
Signal-to-Noise Ratio visualization displays how much stronger the signal strength is than the noise in the given location.
Signal must be stronger than noise for data transfer to be possible. SNR is calculated by finding the strongest received signal power at each location and then calculating the ratio of that power to the noise floor, taking into account the channel bandwidth. In a typical environment, the noise level is about -90 dBm.
%20Study%20Type%20Parameters.png)
Signal to Noise Ratio (SNR) Study Type Parameters
Number of Levels
Color
Value
Description
The number of levels
Color level
SNR, dB
Text field
%20for%20Indoor%20Wi-Fi%20Network.png)
Signal to Noise Ratio (SNR) for Indoor Wi-Fi Network
Channel Interference for Wi-Fi
The Channel Interference shows how many access points are overlapping in a single channel in the given area.
This visualization can display both Co-channel and Adjacent Channel Overlap (for 2.4 GHz only). Channel overlap should be kept to a minimum to ensure interference-free operation.

Channel Interference for Wi-Fi Study Type Parameters
С/I Threshold
С/I Threshold, dB
The minimum ratio of the useful signal to the sum of the interference signals for the correct operation of the demodulator with the required quality. The smaller this ratio, the less the influence of interference.
Number of Levels
Color
Value
Description
The number of levels
Color level
Number of interfering channels. 0 - means no interference
Text field

Channel Interference for Wi-Fi Study Type Parameters
Maximum Downlink / Uplink Throughput
This prediction type shows maximum cell throughput for LTE, 5G and Generic TRX, as well as the maximum data rate (PHY) for Wi-Fi.
For LTE/5G System Types, this study calculates MCS Index for each point based on predicted C/(I+N) from LTE/5G system parameters tab of Network. Throughput associated with MCS is determined using 3GPP specified formulas and tables.
For Wi-Fi System Type, this study calculates MCS Index for each point based on predicted SNR from Wi-Fi system parameters tab of Network. Throughput associated with MCS is determined using 802.11 specified tables.
For Generic TRX System Type, this study calculates Throughput for each point based on predicted C/(I+N) from Adaptive Modulation Table in system parameters tab of Network.

Maximum Downlink Throughput Study Type Parameters
Number of Levels
Color
Value
Description
The number of levels
Color level
Maximum Throughput, Mbps
Text field

Maximum Downlink Throughput Coverage Prediction for indoor 5G CBRS N48 (3500 MHz) Network

Maximum Downlink Throughput Coverage Prediction for oudoor 5G CBRS N48 (3500 MHz) Network
Number of Servers Uplink/Downlink
This study indicates total number of systems that provide a signal above Rx threshold at each location.

Number of Servers Above Downlink Study Type Parameters
Maximum Number of Sectors
Color
Description
Maximum number of displayed servers
Color indicating the appropriate number of servers
Text field

Number of Servers Above Downlink for Wi-Fi
Reference Signal Received Power (RSRP)
This study calculates the Reference Signal Received Power (RSRP) from all resource elements of a cell at the remote UE receiver using system parameters of LTE and 5G networks (bandwidth, subcarrier spacing). You can choose prediction visualization as a heat map or a composite grid.

RSRP as a heatmap visualization
Max Level
Min Level
Max visualization level, dBm
Min visualization level, dBm

RSRP as a composite grid visualization
Number of Levels
Color
Values
Description
The number of levels (1-8)
Color level
Reference Signal Received Power (RSRP), dBm
Text field to describe signal level

RSRP coverage prediction for indoor 5G CBRS N48 (3500 MHz) Network

RSRP coverage prediction for outdoor 5G CBRS N48 (3600 MHz) Network
Reference Signal Received Quality (RSRQ)
This study calculates the Reference Signal Received Quality (RSRQ) from all resource elements at the remote UE receiver using system parameters of LTE and 5G networks (bandwidth, subcarrier spacing, cell load, and C/(I+N) ratio).

RSRQ Study Type Parameters
Number of Levels
Color
Values
The number of levels (1-8)
Color level
Reference Signal Received Quality (RSRQ), dB
Description
Text field to describe signal level

RSRQ coverage prediction for indoor 5G CBRS N48 (3500 MHz) Network
Coverage predictions for multiple networks
Number of Networks Downlink / Uplink
This prediction shows number of networks providing service at each calculation point for downlink or uplink. Calculation is performed for respective thresholds Rx of each network taken into account in calculation.

Number of Networks Downlink Study Type Parameters
Number of Levels
Color
Description
Maximum number networks
Color indicating the number of networks
Text field

Number of Networks Downlink Coverage Prediction for indoor LTE Band 12 and 5G N48
Maximum Aggregated Downlink / Uplink Throughput
This prediction type shows the total throughput at each point for all networks involved in the calculation.

Maximum Aggregated Downlink Throughput Study Type Parameters
Number of Levels
Color
Values
Description
The number of levels (1-8)
Color level
Maximum Aggregated Throughput, Mbps
Text field

Maximum Aggregated Downlink Throughput Coverage Prediction for indoor LTE Band 2 and 5G N48
Wi-Fi Site Survey
Indoor RadioPlanner 2.1 allows for passive survey and visualization of a site's Wi-Fi environment.
During a passive survey, the application collects the most comprehensive data about the Wi-Fi environment: information about access points and their characteristics, signal strength, interference, etc. It is called passive because during this type of survey, the application passively listens for packets and does not try to connect to WLAN networks.
Any Wi-Fi adapter available in the laptop can be used for site survey.
After completing the Wi-Fi survey, the following types of visualizations will be available:
- Received Power
- Secondary Received Power
- Best Server (Best AP)
- Number of Servers (Number of APs)
- Signal to Noise Ratio
- Channel Interference
Performing a Wi-Fi Site Survey
Before performing a survey, you need to create at least one floor (see the Levels section).
The survey is performed using the Step-by-Step method, where the Indoor RadioPlanner collects data only at the location indicated by clicking on the map. In this mode, after marking a location on the map, you must remain in place until the scanner completes its work cycle. Then the data collection stops until you mark the next location, where the scanner again makes a full work cycle.
To work with surveys and subsequent visualization, the main panel of Indoor RadioPlanner 2.1 provides a group of tools:
Wi-Fi Monitor. This tool allows you to get a list of all available access points.
Wi-Fi Survey List. This tool allows you to perform and save multiple surveys in a project.
Wi-Fi Survey Visualization

Wi-Fi Monitor
Start/stop adding new APs to Full AP list based on new measurement results. The stop is disabled with a delay until the end of the scanning cycle.
Add new APs to Full AP list based on all survey results
Clear Full AP list
Spectrum Visualization. This visualization is disabled with a delay until the end of the scanning cycle.
Add selected APs to My AP List
Clear My AP List. Individual rows in the My AP List can be deleted using the Del button.
The Full AP List and My AP List can be sorted in ascending or descending order by any of the columns. This allows you to quickly sort APs by RSSI, band, channel, or bandwidth.

Spectrum Visualization in 2.4GHz
Indoor RadioPlanner 2.1 allows you to make several surveys in a project. Surveys are managed in the Wi-Fi Survey List menu. Current measurements are entered into the active survey.

Spectrum Visualization in 2.4GHz
To start a survey, click on the Add Wi-Fi Survey Point tool on the panel of the floor you are surveying. Then click on the point on the plan corresponding to your location and wait for the full measurement cycle. Until the cycle is complete, the word MEASUREMENT will remain on the screen. Then go to the next location, click on the corresponding point on the plan, and so on. To exit the measurement mode, press the "Add Wi-Fi survey point" button or press Esc.

Performing a Wi-Fi Site Survey
You can work with measurement points on the plan in the same way as with other objects - delete, move, cancel the action, and so on.
Due to the use of standard scanning tools, it is sometimes possible to miss access point beacons. To reduce the impact of this effect on the measurement and visualization of the access points of interest to you, we recommend using the My AP List tool. To do this, first monitor all available Wi-Fi access points on your site using the Wi-Fi Monitor tool. And add the APs you need to My AP List. Now, when performing measurements in the access point list at the measurement point, available access points from My AP List will be marked in green, and unavailable ones in red. Thus, during the measurement process, you can quickly analyze the presence of a signal from the access points of interest and, if necessary, run a repeated measurement cycle for reliability. My AP list has another function - it is used to generate a list of APs for visualization.
Survey Visualization
To visualize survey results, use Wi-Fi Survey Visualization on the main toolbar.
In the window that appears, you can select surveys whose measurement data will be used for visualization. Here, you can also select access points from the My AP List for visualization. The types of available visualizations and their parameters are described below.

Survey Visaulization Parameters
Received Power and Secondary Received Power
Received power coverage map show those areas where a given signal power level is present at the receiver. The Secondary Received Power Coverage Map shows the areas of the second strongest signal at the receiver.
You can choose visualization as a heat map or a composite grid.

Received power as a heatmap visualization
Max Level
Min Level
Max visualization level, dBm
Min visualization level, dBm

Received power as a composite grid visualization
Number of Levels
Color
Values
Description
The number of levels (1-8)
Color level
Received power level, dBm
Text field to describe signal level

Received Power Survey Visualization

Secondary Received Power Coverage Visualization
Best Server (Best AP)
The Best Servers coverage map shows the AP with the strongest signal at each location. An area is considered covered if the signal exceeds a Minimum Received Power level, i.e. strong enough for clients to communicate with the access point.

Best Server Visualization Parameters
Minimum Received Power
Minimum Received Power, dBm

Best Server
Number of Servers (Number of APs)
This visualization shows how many access points cover a given area. An area is considered covered if the signal exceeds a Minimum Received Power level, i.e. strong enough for clients to communicate with the access point.

Number of Servers Visualization Parameters
Minimum Received Power
Maximum Number of Sectors
Color
Description
Minimum Received Power, dBm
Maximum number of displayed servers
Color indicating the appropriate number of servers
Text field

Signal to Noise Ratio (SNR)
This visualization shows the signal-to-noise ratio measured in dB. SNR is a measure to quantify by how much the signal level exceeds the noise level. Noise is generated by non-802.11 sources of radio waves (this includes 802.11 frames damaged during propagation). In low SNR zones, client devices may not be able to communicate with APs. SNR is shown for the AP that has the strongest signal in the given map area among the APs selected for analysis.

Signal to Noise Ratio Visualization Parameters
Minimum Received Power
Noise Floor
Number of Levels
Color
Value
Description
Minimum Received Power, dBm
Noise Floor, dB. The noise level created by the sum of all noise sources and unwanted signals. In a typical environment, the noise level is about -90 dBm.
The number of levels
Color level
SNR, dB
Text field

Signal to Noise Ratio Visualization
Channel Interference
The Channel Interference visualization shows how many access points are overlapping in a single channel in the given area. This visualization can display both Co-channel and Adjacent Channel Overlap (for 2.4 GHz only). The channel overlap should be minimized to ensure interference-free operation.

Channel Interference Visualization Parameters
С/I Threshold
С/I Threshold, dB The minimum ratio of the useful signal to the sum of the interference signals for the correct operation of the demodulator with the required quality. The smaller this ratio, the less the influence of interference.
Number of Levels
Color
Value
Description
The number of levels
Color level
Number of interfering channels. 0 - means no interference
Text field

Channel Interference Visualization
Saving images of Coverage Prediction and Survey Visualization
Save the level plan as a PNG image - Save the result of the coverage calculation or survey visaulization as an image file in *.png format. The saved image will include the same area and Legend placement as currently displayed on the screen. You can select the image resolution and the size of the access point icons. The resolution can match the current size or be two or four times larger. The better the resolution, the larger the saved file size.

Save the level plan as a PNG image
Report
Using the "Save Access Point Settings List as CSV" button on the main toolbar, you can save a configuration report of all access points and networks. This CSV file can then be opened in Excel.

Report in Microsoft Excel
Help
In this menu, you will find information about the developer, a link to the user manual, and an option to check for updates. The trial version will also have links to the purchase page and activation menu. After activating the program, these menu items will disappear.